PWC: GREEN JOBS BAROMETER
The Green Jobs Barometer measures the relative performance of UK regions and industry sectors on their progress developing green jobs* over time. It aims to build an evidence base to assess and support a fair transition to net zero.
“Left unchecked, green employment will grow in the most fertile spots, but not necessarily where they’re needed most. Our research indicates where support and investment needs to be targeted.” Kevin Ellis Chairman and Senior Partner, PwC UK
The barometer is based upon five key pillars which can be explored on the PWC website by sector and region. Click here to access the barometer.
Methodology
Green job creation
Rationale: what does the pillar capture?
This pillar captures performance on creating new green jobs. We focus on green job creation as this is where we expect to first see changes in the labour market (as opposed to the stock of green jobs).
How is performance estimated?
It’s the number of green job advertisements, expressed as a proportion of total job advertisements. This captures the relative density across sectors and regions to enable comparisons.
How can this indicator change over time?
We expect the number to increase over time as the transition to a sustainable economy gathers pace. However, there will be waves of different green job creation across sectors (and regions) over time.
1.2% of advertised jobs are green – equates to 124,600 jobs in 12 months
Wider benefits of green jobs
Rationale: what does the pillar capture?
It seeks to identify where direct green jobs are creating additional employment, helping to show the full benefits of green jobs. It means policy decisions can be based upon wider economic impacts rather than narrow green employment decisions.
How is performance estimated?
It’s based on employment multipliers. This measures how many additional jobs in the UK economy as a whole are created from one green job in a certain sector or region.
How can this indicator change over time?
Multipliers are typically higher in well-paid jobs with extensive local supply chains (typically in highly technical roles). As green activities move from highly technical and design roles into broader roles, multipliers might decrease, but this impact is likely to be minimal over the short term.
1:6 – Each new green job in the energy sector, generates a further 6 jobs in the economy as a whole
Sunset jobs
Rationale: what does the pillar capture?
It provides insight on job destruction. This is vital for designing the right set of active labour market policies – including reskilling and upskilling, and focus on social mobility – in order to ensure a green transition is also a just transition.
How is performance estimated?
By looking at the distribution of defining “sunset jobs” – ie. those jobs that will become redundant following the transition to a green economy. It doesn’t capture job reallocation where, with the right training, people may find employment in growing areas of the same sector.
How can this indicator change over time?
As these career pathways are realised, we expect the number of sunset jobs to decrease over time.
5% of adults believe their job will not exist after the Net Zero transition
Carbon intensity of employment
Rationale: what does the pillar capture?
It compares CO2 emissions in different UK regions and sectors to employment in the same UK regions and sectors.
How is performance estimated?
Performance is estimated using CO2 emissions per employee. This gives us an indication of how environmentally-friendly jobs are, as well as an indirect indication of jobs that could lose out as the green transition accelerates.
How can this indicator change over time?
We expect there will be accelerated change in carbon-intensive sectors, with diminishing returns for low-carbon sectors and regions.
9tonnes : average CO2 emissions per employee (emissions range from zero to 569 tonnes depending on the sector)
Green workspaces
Rationale: what does the pillar capture?
It tells us more about how existing jobs are changing – gathering employee sentiment to give an extra layer of insight.
How is performance estimated?
It measures how environmentally friendly employees perceive the activities conducted as part of their job to be currently, and over the next 1-2 years. It spans 8 environmental outcomes – reducing waste, reducing carbon, reducing pollution, protecting biodiversity, improving resource efficiency, reducing water use, increasing reuse and recycling, and reducing energy consumption.
How can this indicator change over time?
We expect the environmentally friendliness of jobs to increase over time.
56% of employees have been encouraged to adopt sustainable workplace practices
“It is incumbent on all of us to ensure that a reduction in economic opportunity is not the legacy of the green transition. Green jobs must not become elite jobs. With targeted policies, investment, and training, and collaboration between government, business and education providers, a green future can be a future of employment for everyone.” Carl Sizer Head of Regions and ESG, PwC UK
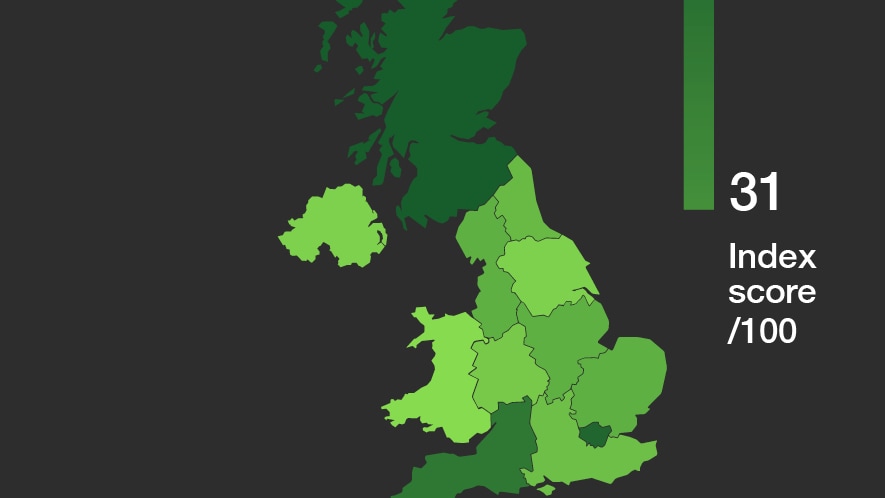
Regional findings
Scotland is the top ranked region in the UK according to the barometer. The share of green jobs created is higher here than in any other part of the UK, and the nation is well positioned to maximise the benefits of green investment.
Northern Ireland has the highest CO2 emissions per employee in the UK, at 13.6 tonnes. This is predominantly because there is limited availability of natural gas in this area, which results in combustion of more carbon intensive fuels instead, such as coal, burning oil, and gas oil. It is least likely to be impacted by ‘sunset’ jobs due to concentration of workforce in low carbon intensive roles, e.g. human health, services and public administration.
Although our survey suggests that jobs in the North East are slightly more environmentally friendly than the UK average, 9% of survey respondents from this region believed their jobs would not exist following the transition to net zero. This means both Government and businesses need to set out a vision for how people in such jobs can be retrained and transition to greener, higher paying roles.
At 1.5%, the North West has the second largest proportion of jobs adverts that we found are green – after Scotland. However, it’s green jobs don’t create as many additional jobs compared to other regions (11th out of 12). The North West should therefore seek to identify higher value green jobs which help build a wider green ecosystem.
Yorkshire and the Humber ranks 10th out of the 12 regions in our overall barometer. This region ranked lowest in the perceived environmental friendliness of their jobs, a finding which is consistent with the high regional composition of hard-to-abate industries. It will require greater support as it transitions away from its historical reliance on heavy industries.
Similar to Northern Ireland, Wales also has a higher proportion of emissions from ‘other’ fuels than the rest of the UK, though to a lesser extent. Wales has the 2nd highest CO2 emissions per employee in the UK, at 12.3 tonnes, and a low proportion of new jobs which are green. Therefore, the focus needs to be on identifying and developing green industries which complement its existing clusters and skills.
Each green job in the electricity and gas sectors generates 6 additional jobs in other sectors of the East of England economy. With offshore wind resources and a planned new nuclear power station at Sizewell, the East of England can support the shift to low-carbon power generation sources.
The East Midlands is third in its employees perception of the environmental friendliness of their workplaces and is the fifth highest region in the proportion of job adverts that are considered green (1.2%).
The West Midlands has not been producing a particularly high proportion of new jobs which are green, but those jobs are creating an above average number of additional jobs. This is likely due to the region’s strength in advanced manufacturing, which typically draws upon an extensive supply chain.
London has a varied performance across our barometer. It performs strongly on employee perceptions on environmentally friendly jobs and on creating a high number of additional jobs from each new green job. Due to its large number of service sector employees, London doesn’t create as high a proportion of new jobs which are green compared to other regions.
The South East has the 2nd largest share of ‘sunset’ jobs and a low rate of only 1.1% of new jobs which are green. With a diverse range of industries and communities, the South East needs to establish which green industries can serve its large population base.
The South West is consistently one of the highest performing regions across each pillar, and is accordingly ranked as the third strongest performing region at the aggregate level. It has strengths in engineering, technical testing and analysis which are particularly useful in the early design stage of developing new green products and processes.
Source – PWC